Category Archives: Science

Are women more honest than men?

The journal Science recently published a fascinating article from Alain Cohn et al, which looked at cultural proclivities for civic honesty around the globe. They employed a rather ingenious method: they “lost” wallets all over the world and recorded when the receiver of the lost wallet attempted to return the wallet to its rightful owner. The wallets were fake and included a false ID of a person who appeared to be local to the country in which the wallet was lost, including fake contact info that actually belonged to the researchers. The ingenious element of the research was that instead of leaving the wallet out in the open, the research assistants actually pretended to have found the wallets in our nearby local businesses and turned in the wallet to somebody working in that business, thus enabling them to record interesting ancillary data on the “subject,” such as their age, if they had a computer on their desk, and whether or not the person was local to the country. Clearly, the researchers were hoping to engage in a little bit of data mining to ensure their not insignificant efforts returned some publishable results regardless of the main outcome.

As it turns out, they needn’t have been concerned. The level of civic honesty, as measured by wallet return rates, varied significantly between cultures. In addition, there is an interesting effect where the likelihood of the wallet being returned increased if there was more money in it, an effect that persists across regions and which was evidently not predicted by most economists. I encourage you to read the original article, which is fascinating. On the top end of the civic honesty scale are the Scandinavian and Northern European countries, with rates at around 75%. On the bottom end of the curve is China, with about 14%. In the case of China, all the study did was confirm what anybody who does business there knows, and something that has been well covered by journalists and completely ignored by our politicians: to the Chinese, not cheating is a sign you’re not trying hard enough.
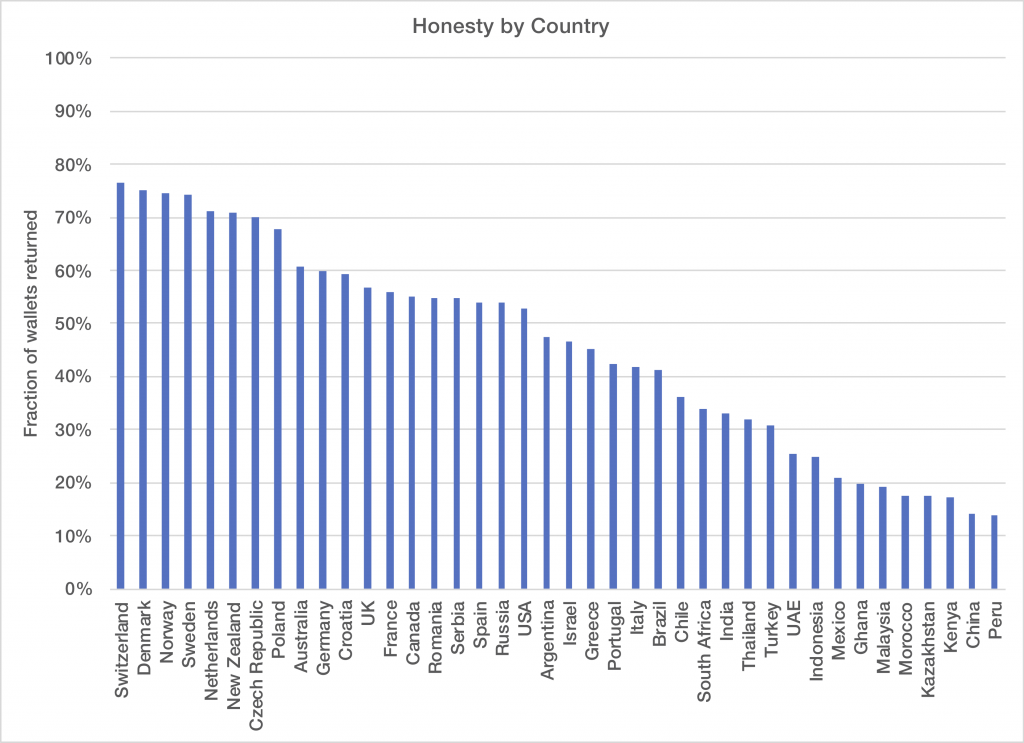
Here’s where things get interesting: in keeping with modern scientific publishing standards, the researchers made their entire dataset available in an online data repository so that others could reproduce their work. There are a lot of interesting conclusions one can make beyond what the authors were willing to point out in their paper, perhaps due to the political implications and the difficulty of doing a proper accounting for all the possible biases. However, unburdened by the constraints of an academic career in the social sciences, I was more than happy to dig into the data to see what it could turn up…

Perhaps the most interesting thing I found is that women appear to be more honest than men. Over the entire world-wide dataset, women returned the wallets about 51% of the time, versus 42% for men. It is tempting to look at individual countries, but the male versus female difference is not statistically significant enough when looking at individual countries, so I chose to only look at the aggregate data. The data is not weighted by country population, so one should take the absolute magnitude of the difference with a bit of skepticism. However, looking at the individual country data it appears a proper accounting for population bias would likely maintain or increase the difference. (Some of the most populous countries had the largest difference between women and men.)
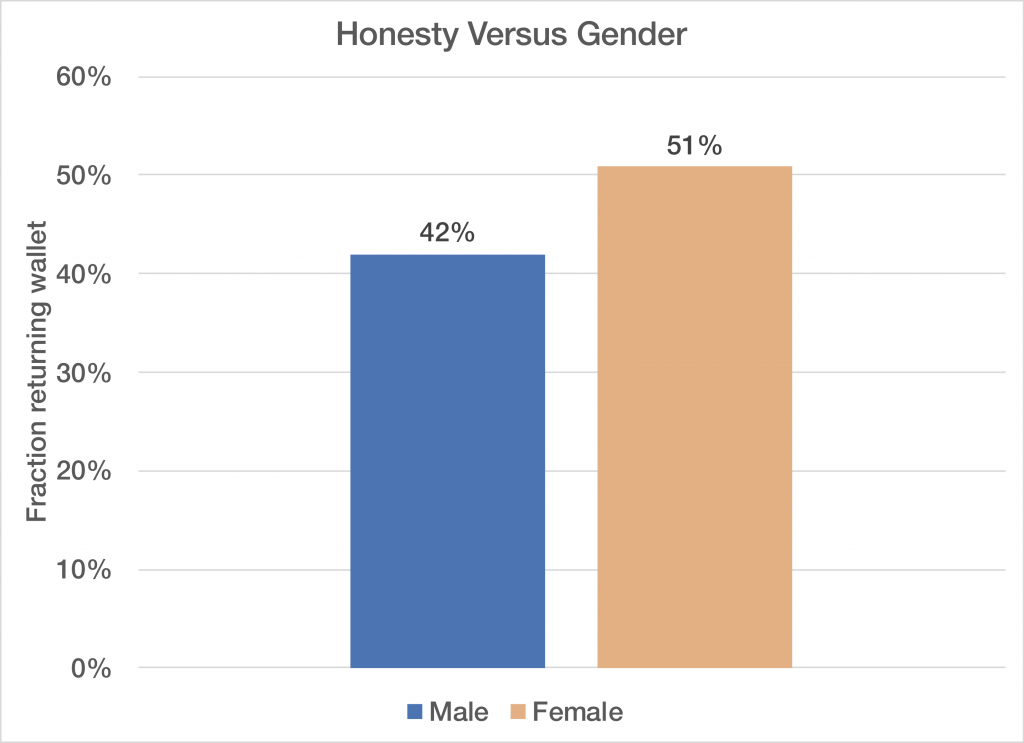
Worldwide, women appear to be statistically significantly more honest than men. Standard error was less than 1% for both cases.

Here is the full dataset of men versus women broken down by country. You can see that the most populous countries are those where women appear to be more honest than men, so fixing the chart above to account for sample bias would likely still find a significant difference.
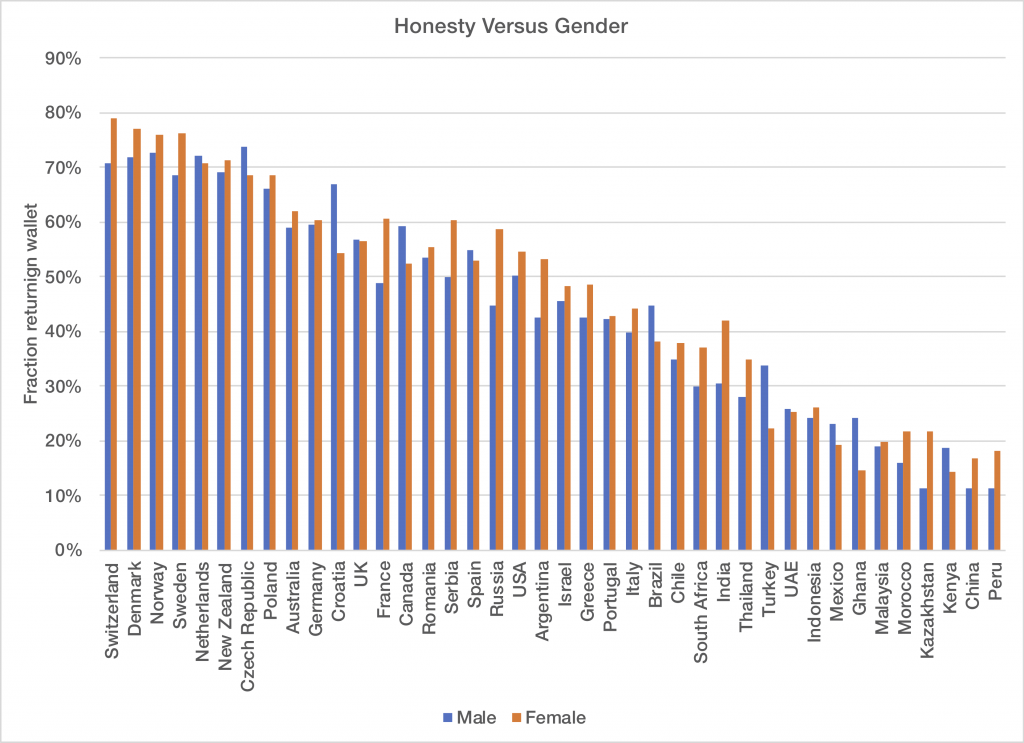
Women appear to be more honest than men in most cultures, though the individual country results are not usually statistically significant.

Another interesting question to ask of the data is whether or not there is a generational difference in honesty. Surprisingly, the answer turns out to be that there’s not a statistically significant difference:
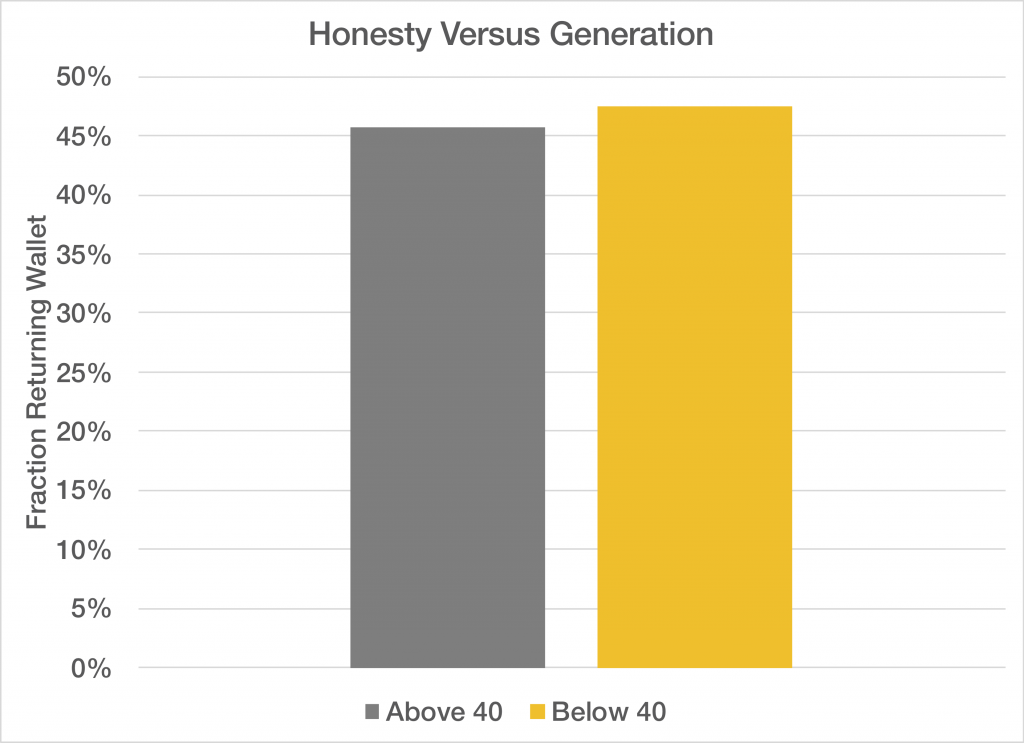
Age doesn’t appear to be a statistically significant predictor of honesty. Standard error was roughly 1%, so the difference shown is not meaningful.

Looking at the breakdown by country, we see that there are no big differences between the generations, with one exception that I’m not even going to try to explain:
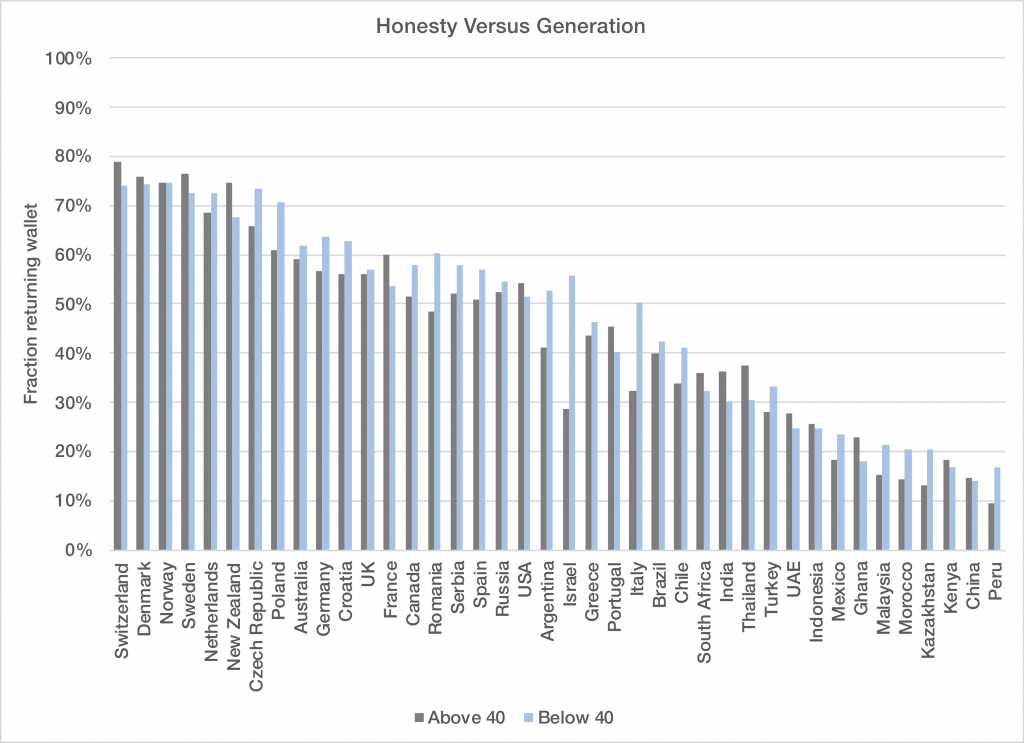
It’s possible that the young are more honest than the old, but it doesn’t appear to be statistically significant except in one country.

One interesting set of issues that always comes up with population studies like this is what, if anything, should we do with this information? It is true that a Swedish woman is about eight times more civically honest, on average, than a Chinese man. That’s interesting, but also pretty dangerous information. Should this inform our immigration policy, where population statistics might actually be valid? Is it better to not even ask these questions given the abuse of the information that might result? Or, is it good to have this information, especially when it flies in the face of our image of ourselves and others? I suspect in the case of the US, most would be surprised to find out that the average US citizen is as honest as the average Russian. We may be surprised by both halves of that statement, and both might be good to think about.

Hypothesis testing proves ESP is real

Or maybe it would be more accurate to say that ESP proves frequentist statistics isn’t real. In what has got to be one of the best object lessons in why hypothesis testing (the same statistical method usually used by the medical research industry to produce the Scare of the Week) is prone to generate false results, a well-respected psychology journal is set to publish a paper describing a statistically significant finding that ESP works.

The real news here, of course, is not that ESP has been proven real, but that using statistics to try to understand the world is a breeding ground for junk science. If I had to guess, I’d say the author (who is a well-respected academic who has never published any previous work on ESP) has had a case of late-career integrity and has decided to play a wonderful joke on the all-too-deserving field of psychology by doing a few experiments until obtaining statistically meaningful results that defy everything we know about the universe. As I’ve pointed out before, one of the many problems with hypothesis testing is that you don’t have to try all that hard to prove anything, even when done “correctly,” given that nobody really keeps track of negative results.

Do open-access electronic journals really help science?

The latest fad in the scientific publishing world is open access e-journals. In my field, for example, the Optical Society of America’s Optics Express has become one of the most popular journals, despite being only a decade old. The journal is basically a peer-reviewed website; people submit self-produced papers in either Word or LaTeX form, and those that are accepted are made directly available in PDF form on the website for free download. In theory, this democratizes access to the scientific literature, and increases the distribution of knowledge, but it comes at a cost.

In order save money, the OSA foregoes the cost of typeset articles produced by a professional editor. The optics literature is now awash with papers produced in Microsoft Word. Much of it has the production value of a junior high book report, except with more equations. Word was never meant for mathematical typesetting (and frankly it’s not worthy of anything published) and the results are abysmal and amateurish. Even though it doesn’t technically affect the content, we should take some pride in the presentation of our work. At best, poorly produced papers are inefficient to read, and at worst, they contribute a subtle psychology that says that sloppy work is acceptable and that what we do is not worth the effort to present well.

[Update: The lack of typesetting in Optics Express helps keep the publication charges around $1000 for most articles. As pointed out PlausibleAccuracy below, not all OA journals are author typeset. For example, the Public Library of Science has beautifully produced articles. However, they charge more than twice what the OSA charges to publish.]

In any case, this brings us to the most problematic issue: The way most open-access journals work is by charging an arm and a leg to the authors for publication. Not only does this limit the people who can publish to those with sufficient funding, it also puts the journal in a position of conflicted interest. As professional societies struggle financially, they are under pressure to accept more papers to bring in cash. With open-access, they make money by accepting papers. With closed journals, they make money by producing good journals.

As I understand it, Optics Express is actually a profit center for the OSA. They cannot possibly be objective about peer review when each rejection costs them thousands of dollars. In the end, editors have a lot of power; I recently reviewed a paper for a ultrashort pulse measurement technique that would not work for the majority of cases one would encounter in practice. I pointed this out, and recommended the article be significantly redone. Next month, I found it in Optics Express, virtually unchanged.

So, we’ve democratized the consumption of information at the expense of the democratization of its production. Do you want the best ideas to be published, or the widest distribution of marginal content? I’d argue that society is best served by making sure the best ideas are published, even if it means having to charge for access to those ideas.

While ensuring that people in developing nations are not denied access to information for want of money sounds noble, should we not also be worried about bad science being published for want of money by the publisher, or good science not being published for want of money by the scientist? In fact, perhaps we shouldn’t even be all that concerned that somebody who can’t afford a $25 journal article is not be able to read about a $250,000 laser system. I know that’s harsh, but there is a certain logic to it: if you can’t afford the journal article, you probably can’t do much with the knowledge.

I do agree with the principle of free access, but only if it’s done with integrity. Ideally, journals should be handled by foundations, with publication and distribution paid for by an endowment to be used only for that purpose. At the very least, there should be no overt financial incentives or disincentives to publication for either party. The primary concern should be the quality of the publications, not the political correctness of its distribution.

The Great Hudson Arc: A 250-mile-wide mystery

Annotated satellite photo of Hudson Bay arc.
Great Arc of Hudson Bay. (Click for a larger view.)

It’s nice to find out that there are still mysteries left in this world, let alone ones that are visible from space. On the southeast corner of Hudson Bay, the coastline traces a near perfect arc, roughly concentric on another ring of islands in the bay. So, what caused it? The obvious answer, proposed in the 1950s, is that it’s the remnants of a large impact crater. Apparently, however, there is none of the usual geologic evidence for this, and over the past 50 years, there has been debate on its origins. From other sites I’ve read, many geologists seem to have concluded that it is a depression caused by glacial load during the ice age, though a recent conference paper (2006) argues that it may indeed be a crater. The current thinking is summarized nicely on this web page:

There is fairly extensive information on this in Meteorite Craters by Kathleen Mark, University Press, isbn 0-8165-1568-9 (paperback). The feature is known as the Nastapoka Arc, and has been compared to Mare Crisium on the Moon. There is “missing evidence,” which suggests that it isn’t an impact structure, however: “Negative results were . . . reached by R. S. Dietz and J. P. Barringer in 1973 in a search for evidence of impact in the region of the Hudson Bay arc. They found no shatter cones, no suevite or unusual melt rocks, no radial faults or fractures, and no metamorphic effects. They pointed out that these negative results did not disprove an impact origin for the arc, but they felt that such an origin appeared unlikely.” (p. 228)

I know next to nothing about geology, but in the spirit of rank amateur naturalists that came before me, I won’t let that stop me from forming an opinion. In physics, whenever you see something that is symmetric about a point, you have to wonder about what is so special about the center of that circle; could it really be chance that roughly 800 miles of coastline all aim at the same point? If not, what defined that point? One explanation for how large circular formations are created is that they start as small, point-like features that get expanded over eons by erosion. In other words, the original sink-hole that started to erode is what defines the center of the improbable circle. There are also lots of physical phenomena that makes circles, such as deposition and flow of viscous materials from a starting point, assuming isotropic (spatially uniform) physical conditions everywhere. However, the planet is not isotropic. In fact, you can see plenty of arc-like features on coastlines and basins visible from satellite photos, and I can’t find a single one that is even close to as geometrically perfect as the Hudson Bay arc. If you overlay a perfect circle on Hudson Bay, as I’ve done in the picture, you see that it is nearly a perfect circle. How would erosion, or a glacial depression, manage to yield such a perfect geometry over such a large scale? Is it possible for the earth to be that homogeneous over such a large distance, and over the geologic span of time required to create it? To my untrained eye, at least, it screams single localized event.

If so, it would’ve been a major event, on par (at least based on size) with the impact site that is credited with putting a cap on the Cretaceous Period and offing the dinosaurs. On the other hand, this fact only serves to heighten the mystery, as you’d think there would be global sedimentary evidence for it. Whether the arc is the result of one of the biggest catastrophic events in earth’s history, or an example of nature somehow managing to create a near perfect circle the size of New York State by processes acting over unimaginably long spans of time, its mere existence is absolutely fascinating.

Studies show reading this essay will make you smarter

Recently, there was an interesting article in BusinessWeek about the flip-flop of studies on the efficacy of echinacea to cure the common cold. The article focused on the possibility of incorrectly performed studies. But, there may have been nothing wrong with any of the studies, even though they differed in their results. The statistical nature of clinical studies means there is always a small possibility that false effects will be seen. However, biases inherent to statistical research may result in a surprisingly large percentage of published studies being wrong. In fact, it has been suggested that the majority of such studies are.

First, I’ll have to briefly explain something about how statistically-based studies are done. When people do such trials, they consider as “significant” any result that would only happen by chance 1 in 20 times. In the language of statistics, they design the study so that the “null” hypothesis (e.g. that echinacea has no effect on a cold) would only be rejected falsely at most 5% of the time based on the normal random variability expected in their study. In other words, they accept that 5% of the time (at most) they will erroneously see an effect where there truly isn’t any. This 5% chance of a mistake arises from unavoidable randomness, such as the normal variation in disease duration and severity; in the case of the echinacea studies you might just happen to test your drug on a group of people who happened to get lucky and got colds which were abnormally weak.

In summary, to say a drug study is conducted at the 5% significance level, you are saying that you designed the study so that you would falsely conclude a positive effect when there were none only 5% of the time. In practice, scientists usually publish the p-value, which is the lowest significance (which you can only compute after the fact) that would have still allowed you to conclude an effect. The main point, however, is that any study that is at least significant at the 5% level is generally considered significant enough to publish.

So, being wrong at most 1 in 20 times is pretty good, right? The cost of putting a study out there that is wrong pales in comparison to the good of the 19 that actually help, right? Does it really matter if, of the 1000s of studies telling us what we should and shouldn’t do, dozens of them are wrong? In theory, there will always be an order of magnitude more studies that are truly helpful.

The problem is, this conclusion assumes a lot. Just because the average study may have a p-value of, say 2%, it doesn’t mean only 2% of the studies out there are wrong. We have no idea how many studies are performed and not published. Another way of looking at the significance level of an experiment is “How many times does this experiment have to be repeated before I have a high probability of being able to publish the result I want?” This may sound cynical, but I’m not suggesting any dishonesty. This kind of specious statistics occurs innocently all the time due to unknown repeated efforts in the community, an effect called publication bias. Scientists rarely publish null findings, and even if they do, such results are unlikely to get much attention.

Taking 5% as the accepted norm for statistical significance, this means only 14 groups need to have independently looked at the same question, in the entire history of medicine, before it’s probable that one of them will find a falsely significant result. Perhaps more problematically, consider that many studies actually look at multitudes of variables, and it becomes clear that if you just ask enough questions on a survey, you’re virtually guaranteed to have plenty of statistically significant “effects” to publish. Perhaps this is why companies find funding statistical studies so much more gratifying than funding the physical sciences.

None of what I have said so far is likely to be considered novel to anybody involved in clinical research. However, I think there is potentially another, more insidious source of bias that I don’t believe has been mentioned before. The medical research community is basically a big hypothesis generating machine, and the weirder, the better. There is fame to be found in overturning existing belief and finding counterintuitive effects, so people are biased towards attempting studies where the null hypothesis represents existing belief. However, assuming that there is some correlation between our current state of knowledge and the truth, this implies a bias towards studies where the null hypothesis is actually correct. In classical statistics, the null hypothesis can only be refuted, not confirmed. Thus, by focusing on studies that seek to overturn existing belief, there may be an inherent bias in the medical profession to find false results. If so, it’s possible that a significant percentage of published studies are wrong, far in excess of that suggested by the published significance level of the studies. One might call this predisposition toward finding counterintuitive results “fame bias”. It may be how we get such ludicrous results as “eating McDonald’s french fries decreases the risk of breast cancer,” an actual published result from Harvard.

Statistical studies are certainly appropriate when attempting to confirm a scientific theory grounded in logic and understanding of the underlying mechanism. A random question, however, is not a theory, and using statistics to blindly fish for novel correlations will always produce false results at a rate proportional to the effort applied. Furthermore, as mentioned above, this may be further exacerbated by the bias towards disproving existing knowledge as opposed to confirming it. The quality expert W. Edwards Deming (1975) once suggested that the reason students have problems understanding hypothesis tests is that they “may be trying to think.” Using statistics as a primary scientific investigative tool, as opposed to merely a confirmative one, is a recipe for the production of junk science.